SRT & Microphone Audio Visualizer
A Python tool that receives microphone or SRT network audio, records it, and displays its changing waveform and frequency content for a coral reef monitoring project.
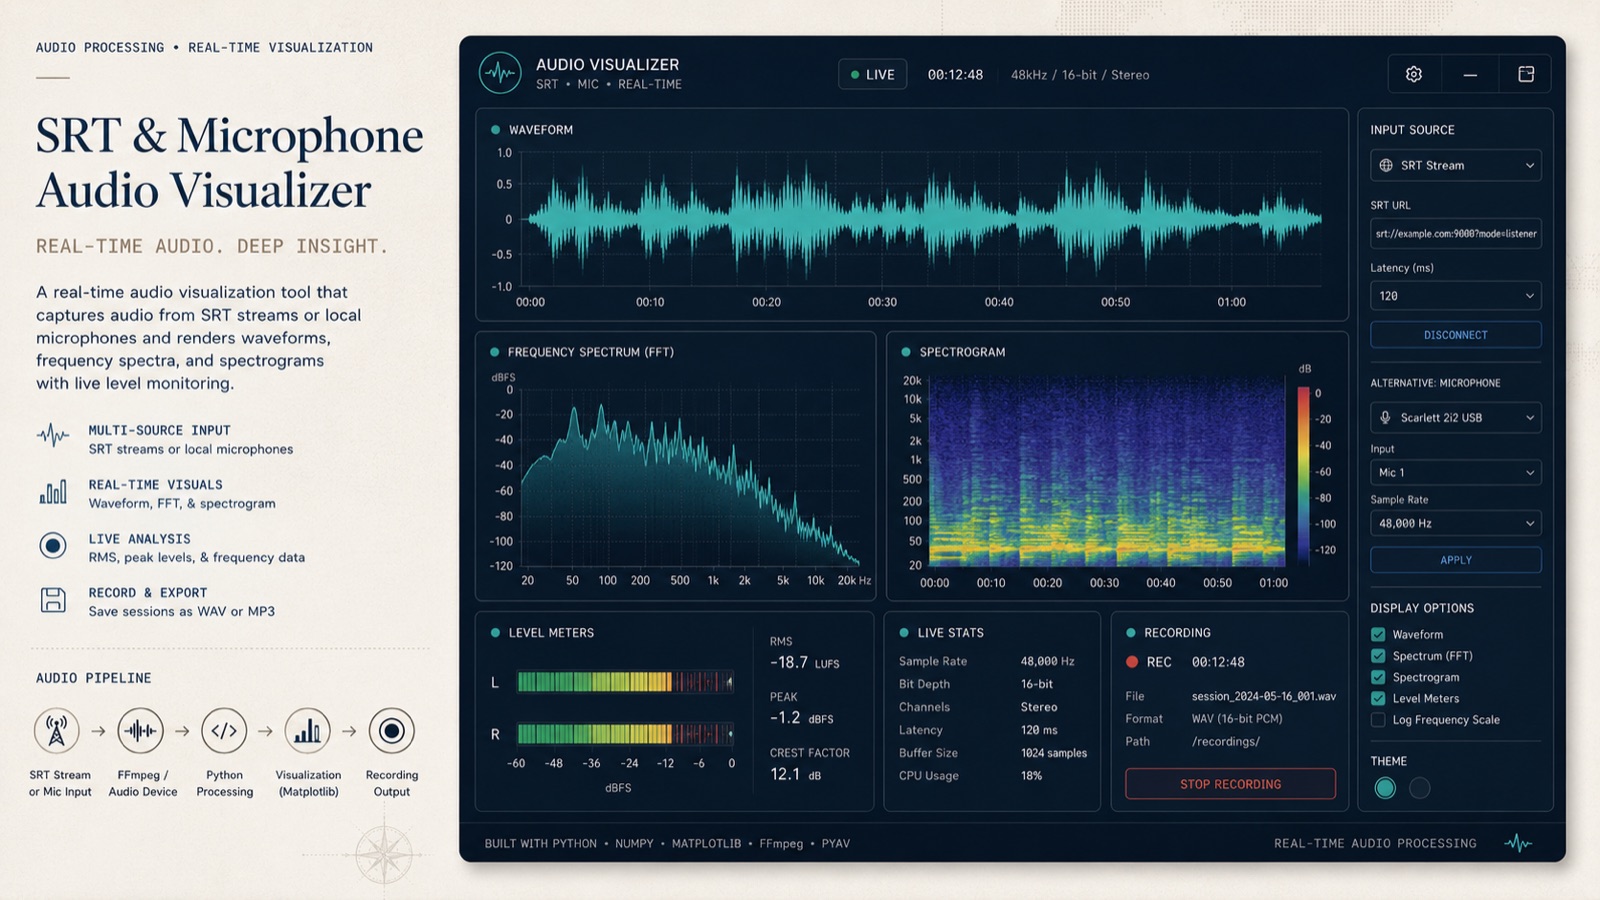
Seeing what the audio contains
This tool was developed for Raspberry Pi as part of a project on remote monitoring of coral reef underwater sounds. It provides a way to inspect incoming audio while retaining a recording for later examination.
I built the capture, processing, and visualization workflow in Python. A user selects a local microphone or an SRT network stream, chooses which plots to display, and sets the frequency range they want to inspect.
Two inputs, a common processing path
The microphone path captures samples through an audio input library. For an SRT stream, FFmpeg receives the network audio and converts it into raw samples that Python can process. Both paths feed the visualization workflow, with recording and playback handled by the supporting audio tools.
Queues pass incoming samples and calculated frequency data to the plot updates. Rolling buffers retain a recent window of audio, allowing the display to move forward as new samples arrive.
Three views of the same signal
| View | What it shows |
|---|---|
| Waveform | Amplitude over time, making changes in the shape and level of the incoming signal visible. |
| Frequency spectrum | The relative strength of frequencies in a recent audio window, calculated with a fast Fourier transform (FFT). |
| Spectrogram | Frequency content over time, using color to show how its intensity changes. |
Connecting capture with interpretation
NumPy handles sample arrays and FFT calculations; Matplotlib presents the plots. FFmpeg and the audio libraries support the surrounding capture, playback, and recording work.
The views help a researcher locate changes and recurring patterns in a recording. Interpreting what produced a sound remains a separate step, informed by the recording and the conditions in which it was captured.