Workflow Automation Dashboard
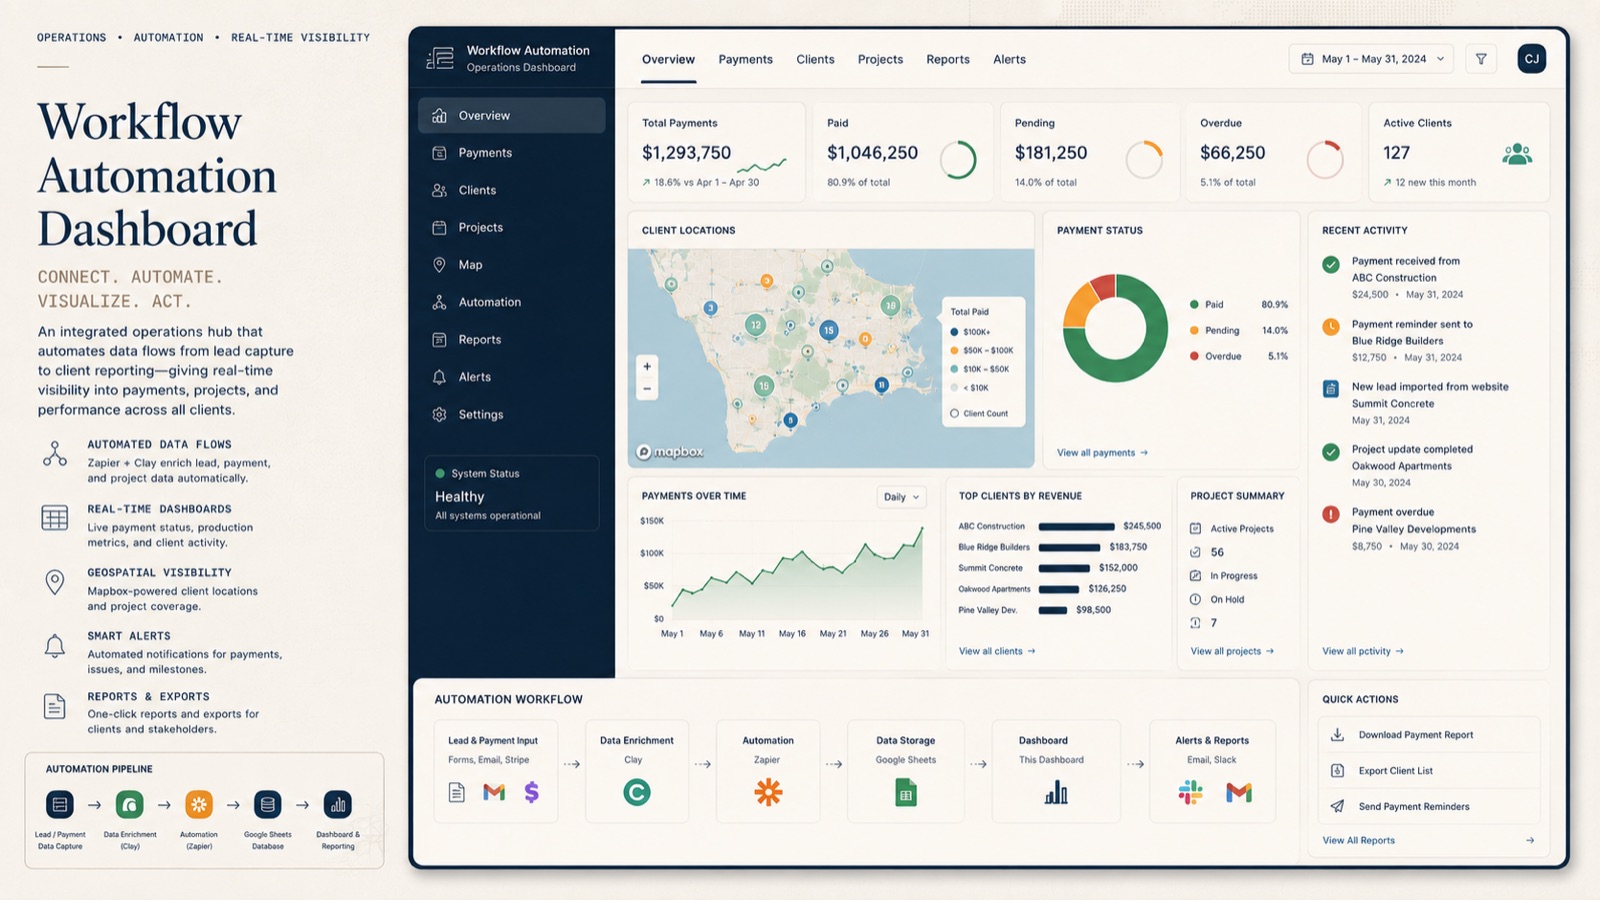
A connected workflow and dashboard for tracking a construction company’s payment records, reviewing payment status, and exploring where its clients are located.
From individual records to a useful overview
A payment record answers a question about one transaction. An operations team also needs to understand the wider picture: payment volume, the mix of statuses, average amounts, and the distribution of clients.
I built this system to connect record collection and updates with an interactive Retool dashboard. It combines automation for repeated data handling with views that make the collected information easier to review.
How information reaches the dashboard
- Collect and enrich leads. Clay supports intake and enrichment, adding context to the records entering the workflow.
- Carry updates between tools. Zapier connects workflow steps, including handling new payment records and changes to payment status.
- Keep the records available. Google Sheets provides the shared tabular data used in the workflow.
- Present the operating picture. Retool brings payment summaries and interactive views into one dashboard.
Two ways to examine the business
The payment views show volume, status, and averages. A Mapbox view adds client locations, with points that a viewer can interact with to explore their geographic distribution.
These views answer related questions at different scales. Payment summaries show the overall mix of recorded activity, while the map helps someone understand where the clients behind that activity are located.
Keeping updates and interpretation connected
The dashboard reflects the information carried through the workflow. Its usefulness depends on keeping those source records current and making their status understandable. Connecting the tools gives the team a shared place to inspect the collected data as the business’s records change.