Impact of Global Events on Market Trends
Impact of Global Events on Market Trends
This project explores the relationships between global events (e.g., wars, pandemics, and energy shifts) and their impact on stock markets, GDP trends, and energy performance, using interactive visualizations built with Observable and Plotly.js.
Key Features
- Interactive Graphs:
- COVID-19 Impact: Visualize changes in GDP across countries during the pandemic.
- War Trends: Analyze defense sector stock performance during major conflicts.
- Energy Performance: Compare clean and dirty energy performance over time.
- Geospatial Visualizations:
- Map-based representations of GDP and other economic indicators.
- Highlight regions affected by specific global events.
- Real-Time Interactivity:
- Dynamic sliders and selectors for filtering time ranges.
- Toggle visibility for individual data sets (e.g., clean vs. dirty energy).
- Data-Driven Insights:
- Aggregated data from diverse sources (e.g., GDP trends, energy markets).
- Provides an intuitive exploration of complex datasets.
Visualization Examples
- War Trends: Stock market analysis during global conflicts.
- Energy Performance: Comparative trends of clean and dirty energy.
- COVID-19 Impact: GDP trends across countries before, during, and after the pandemic.
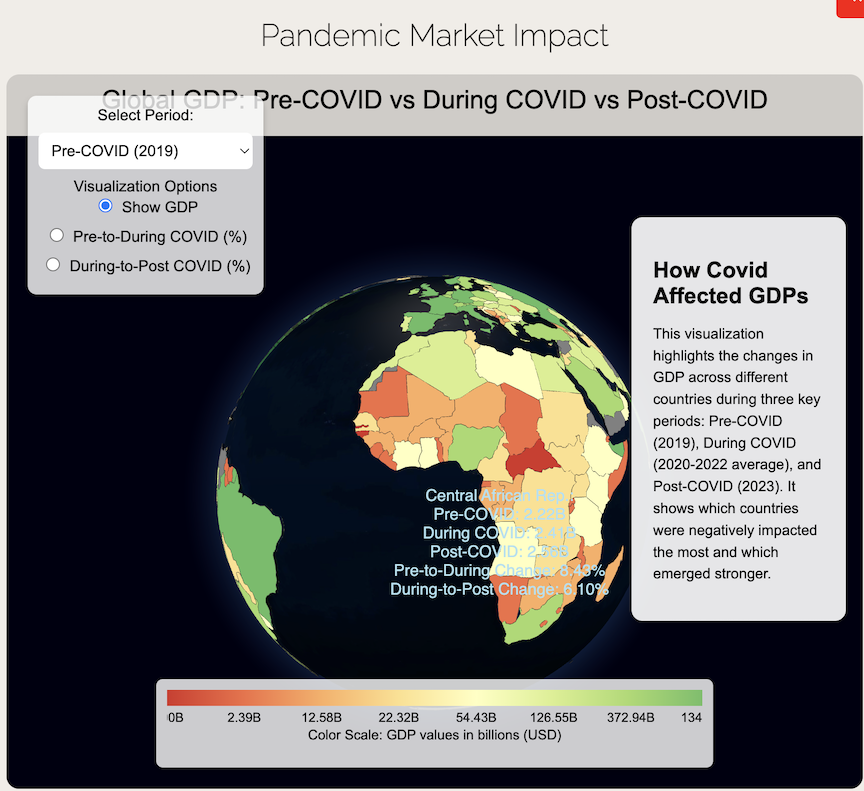
Figure: Interactive graph highlighting stock market trends before, during, and post Pandemic.
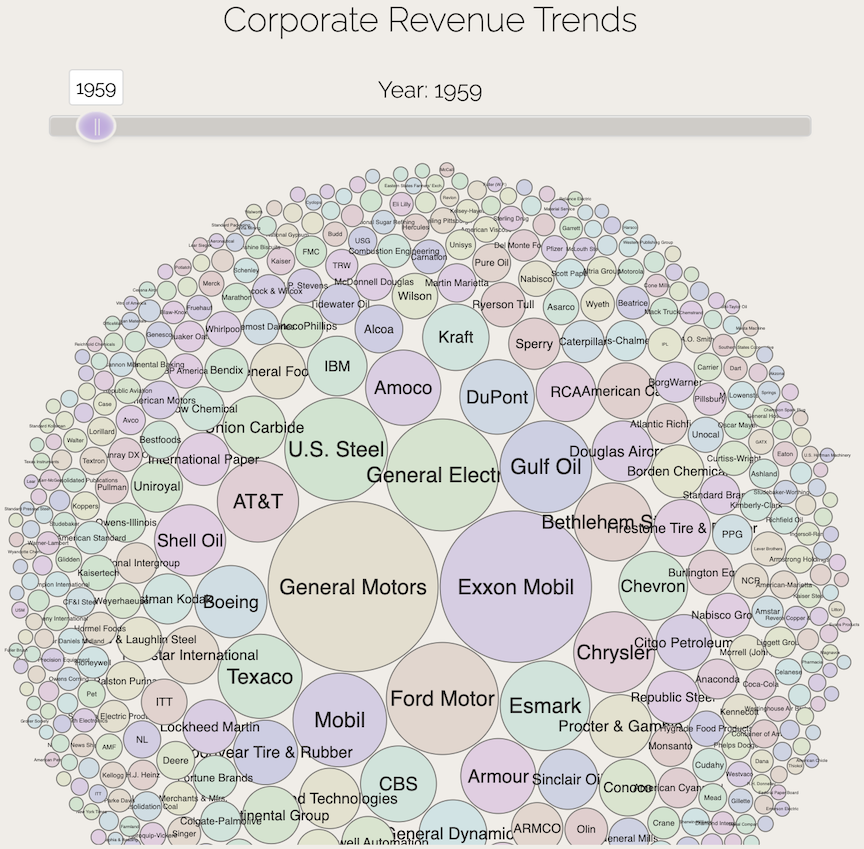
Figure: Interactive graph highlighting Fortune 500 companies over the past ~70 years.
Interactive Demo
Video: Walkthrough of the website and interactive visualizations.
Usage
- Explore the Homepage:
- View key visualizations in the interactive carousel.
- Select specific graphs for a deeper dive.
- Interact with Visualizations:
- Use sliders, dropdowns, and checkboxes for filtering and comparisons.
- Hover over elements for detailed tooltips and insights.
- Analyze Trends:
- Use geospatial maps and time-series plots to explore correlations between events and market movements.
Architecture Overview
- Frontend:
- Built using React.js and Plotly.js for rendering dynamic graphs.
- D3.js for geospatial visualizations.
- Backend:
- Data sourced from static CSVs and JSON files (e.g., GDP trends, energy data, market trends).
- Hosting:
- Designed for deployment on GitHub Pages or similar static hosting platforms.
Applications
- Economic Research:
- Analyze GDP and energy performance trends over time.
- Study the impact of wars and pandemics on global markets.
- Education:
- Interactive visualizations for teaching data analysis and visualization concepts.
- Business Insights:
- Explore stock market behavior during crises to inform investment strategies.
Performance Highlights
- Optimized Visualization:
- Built with Observable for seamless interactivity.
- Leverages modern JavaScript libraries like Plotly.js and D3.js.
- Data Efficiency:
- Uses preprocessed datasets for efficient rendering.
- Supports large-scale data visualization with minimal performance overhead.
This project provides a rich, interactive experience for analyzing global events and their impact on key economic indicators. Let me know if you need adjustments or additional details!